

You've got the next best thing in the world on your hands. Your startup is going to obliterate your industry, decimate 'competitors', and land you on the front page of Time magazine for Human of the Year. Or at least, once you figure out how to advertise it.
Here's the strategy that every startup should be using if they want to survive: Multivariate Testing.
In short, you're going to come up with incredible ideas, build assets around them, test those ideas on a live ad network (for <$300), then interpret your data to find your perfect ad. All in 7 days.
Your step-by-step guide:
- 'Big Idea' Generation
- Creative Assets
- Multivariate Matrix
- Live Testing
- Finding Your Perfect Ad
Step 1: What's the 'Big Idea'?
Back in the 60's there was a 'Creative Revolution' in advertising. If you've seen Mad Men, you know what I'm talking about. If you haven't, basically, a few guys like David Ogilvy, Bill Bernbach, and George Lois started coming up with ad ideas so wild, people would die to buy from them.
Ogilvy's identification criteria for a 'big idea':
- Did it make me gasp when I first saw it?
- Do I wish I had thought of it myself?
- Is it unique?
- Does it fit the strategy to perfection?
- Could it be used for 30 years?
From Ogilvy on Advertising.
Lois' criteria:
- Penetrates minds
- Warms hearts
- Causes action
From Damn Good Advice.
Some famous examples of 'big ideas':

It's clear what each did with their ads: they each pushed one thought into the minds of their audience. For Ogilvy, it's that Rolls Royce is a silent car; for Lois, that Tommy Hilfigher is on par with Ralph Lauren, Perry Ellis, and Calvin Klein; for Bernbach, that small cars are best, and VW's buggie is the only car of its class.
The key is finding the one thing about your company that solves the most problems, makes people the happiest, or appeals most to your audience. To find the right 'one', you need to come up with hundreds. Just like in sales, there's an idea funnel. You'll want to cut it down to 3-5 of your best ideas.
There are thousands of book on how to come up with your 'Big Ideas'. Anything on creativity will do too.
Some recommendations:
- 101 Creative Problem Solving Techniques by James Higgins
- A Whack on the Side of the Head by Roger von Oech
- The Art of Creative Thinking by John Adair
- This incredible website with categorized techniques: https://www.mycoted.com/Category:Creativity_Techniques
By the way, if you're interested in any of these books, I can email you an ebook copy. Send your request to Brett@marpipe.com.
Once you find 3-5 'big ideas', you can move to step 2: making creative assets.
Step 2: Making Creative Assets
To make an ad, you need to make creative assets.
Creative assets are raw images and videos of your product or anything you'd use in an ad. In the above ads, you have one image asset and one copy asset.
In a modern digital ad, you have a few more assets:
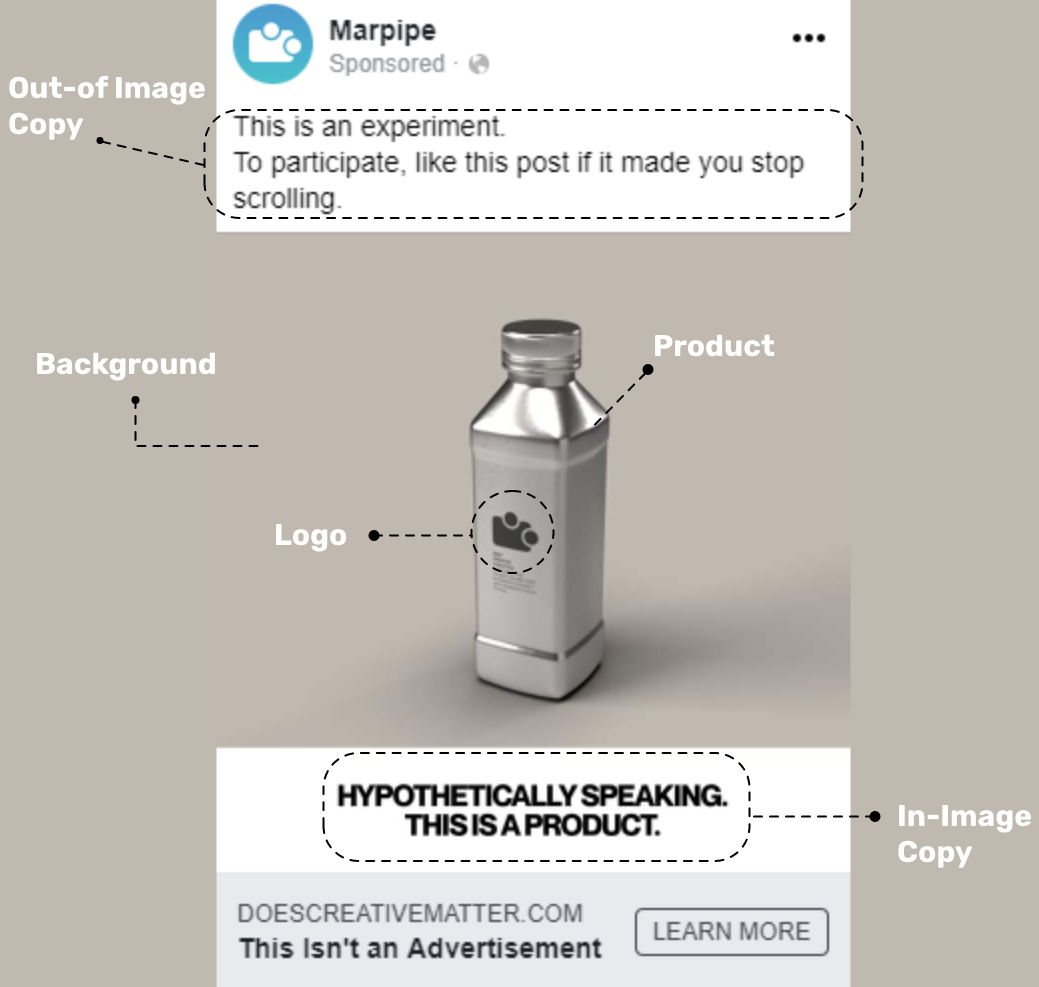
Other assets include, but are not limited to:
- Product UI Screenshots (for apps and SaaS products)
- Model Shots
- Brand Collateral (Tag Line, Color Palette)
Anything you can isolate and put into an ad is a creative asset. Your 'big ideas' are creative assets: copy assets.
To keep your campaign below $300, you'll want to focus on a few core assets to test. I suggest making a few different backgrounds, a couple different product shots, and using your 'big ideas'.


Step 3: Making Your Multivariate Matrix
I hope you like little alliterations. If not, you're about to prefer them over this next step.
Open your favorite image editor. I prefer Adobe XD. Mostly because the name has an emoji (XD) in it.
Take your 3 backgrounds, 2 product shots, and your 3-5 'big ideas', then combine them in every way possible.
Like this:
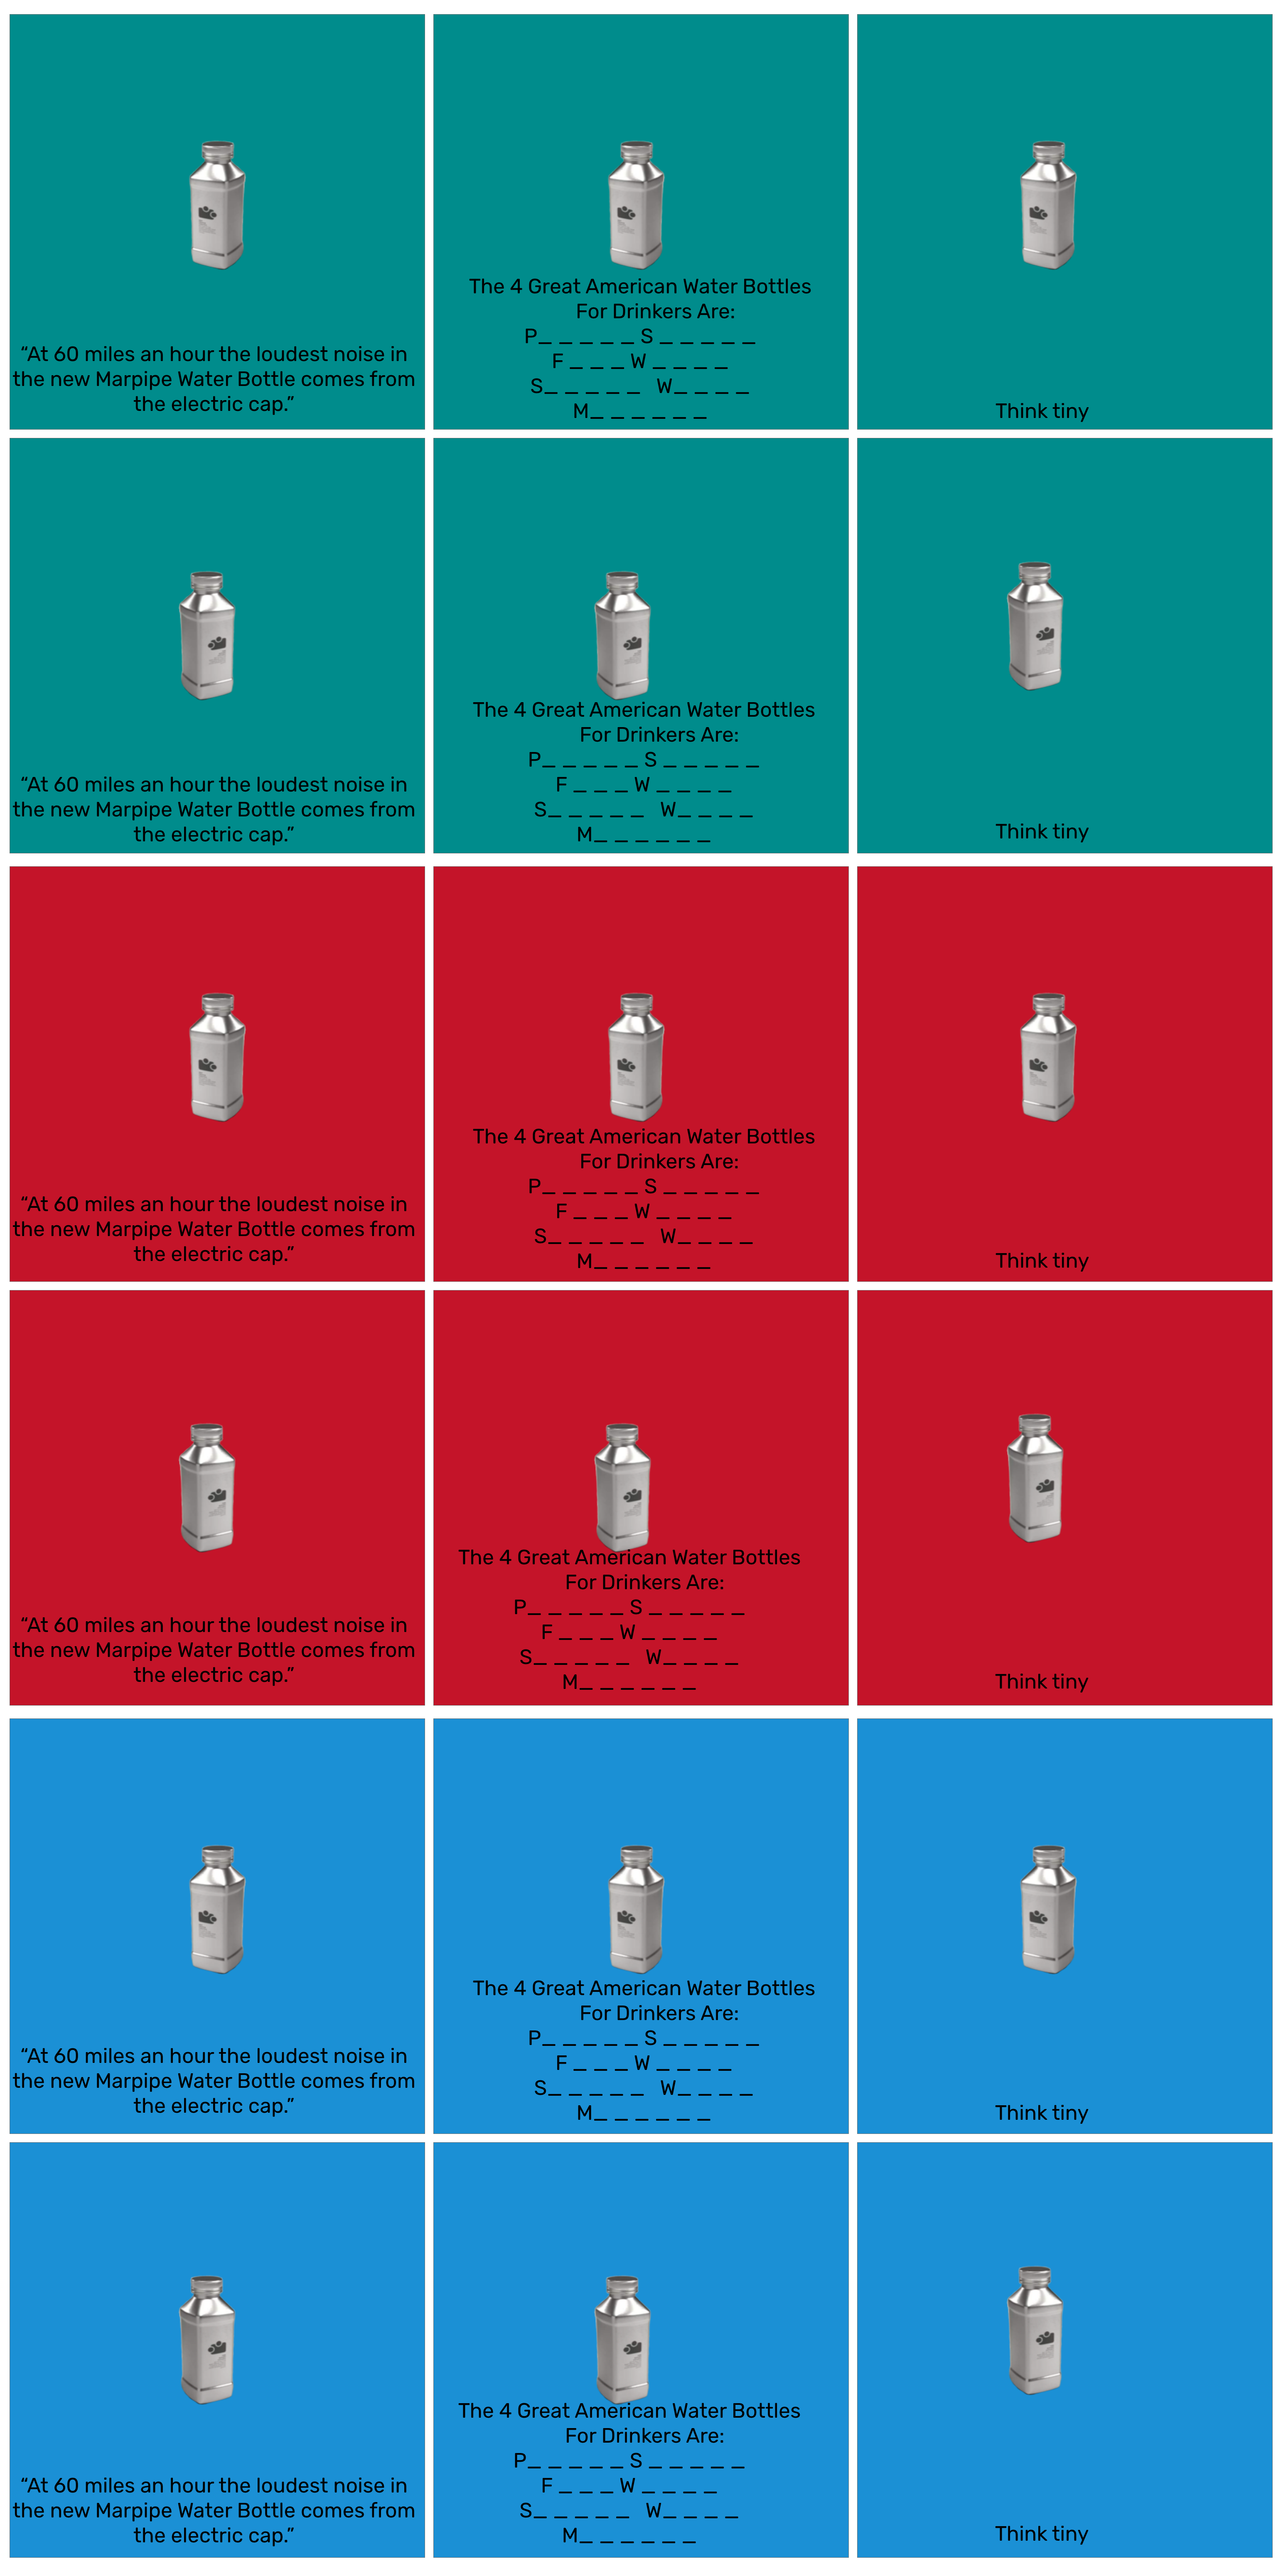
Make sure to name your ads by the components that make them up. For example, the first ad in the top left might be called: Background(MarrsGreen)_Product(LeftTilt)_Copy(BigIdea1). This will save you time analyzing the data later.
Step 4: Testing Your Ads on a Live Ad Network
The tedium is over. Now comes the fun part. Uploading, budgeting, and running your ads live!
You can use any ad network you want, but Facebook tends to be the best bang for your back. They also have an intuitive, powerful targeting system. We'll leave it off for now.
There are two ways to upload your ads to Facebook:
- The Quick, but Sloppy Way: Batch-Uploading
- The Slow but Sure Method: Manual Uploading
To batch-upload your ads, use Facebook's official guide. In short, put your ads in a spreadsheet, name your columns correctly, and submit them all at once.
To manually upload your ads, go into your Ad Account and create a new campaign, new ad sets, and upload each ad individually.
The one piece that's absolutely crucial to you test's success and therefore to finding your best ad, is to PUT EACH AD IN ITS OWN AD SET. This needs to be stressed more.
If you put all your ads into one ad set, Facebook will automatically optimize your budget to spend on the ads it thinks are the best. But it doesn't know what's best. It only knows what will make Facebook more money.
What you want is to find out what will make you the most money.
To do that, you need to put each ad in its own ad set.
You also need to put the same exact amount of money behind each ad. Run them for the same amount of time. And leave the account alone no matter what it looks like! Don't touch it. you'll want to shut off what you think are the losing ads. But they might get better. The good ads might get worse.
And more than anything else, you need their data. You're doing this to learn what works and what doesn't. You won't know for sure until you wait long enough.
How long is long enough? It depends on two factors:
- Audience Size
- Conversion Rate
The larger the audience, the quicker (and generally cheaper), you will hit statistical significance.
Statistical significance is the point at which you have enough to data to make decisions from.
This point is somewhere between 30-50 conversions for each component. Since you have each component in 6-9 ads, you need fewer than 10 conversions per ad. A higher conversion rate will hit significance earlier. You can increase your conversion rate significantly by using Clicks as your KPI rather than Leads.
Clicks are also significantly cheaper than leads. A click might cost ¢45, while a lead could cost $50.
Cost also depends on your industry; And how many other people are targeting your audience. That's why you kept your target audience broad earlier.
It's also good practice to run your ads for at least 7 days. Ads have drastically different performances on Mondays than Saturdays (or any day than any other day). To avoid this problem, run your ads for at least a week, and in increments of 7 days.
The average cost per click across all industries was $1.72 in 2019.
With 8 components in 18 ads, you need between 3 and 5 conversions per ad for significance. Targeting clicks ($1.72 each), that means you only need between $92.88 and $154.80 to hit significance. Across 7 days, that's between ¢.73 and $1.23 per ad per day.
*An important note: Facebook's minimum ad spend per ad per day is $1.
So you can run this entire test for a $18 a day. That's $126 total!
You can run an entire multivariate creative test over 7 days for $126
TL;DR:
- Upload your ads in their own ad sets
- Put the same amount of money behind each ad
- Let them run for 7 days
For more on MVT pricing, check out this full post on how to calculate ad spend for a creative test.
Step 5: Finding Your Perfect Ad
You did it. Spent $126. Run 18 ads. 7 Days. Now what?
Now you perfect your advertising.
Open up your facebook business manager, head to your test campaign, and dive into your ads.
There are a few final steps you can take. I recommend them all.
- Use your top performers
- Use your top components
- Continue Testing
The first and easiest thing to do is sort your ads by Cost per Result, take your cheapest 1-5 ads, then put all your future ad spend behind them. You now have validated, high performing ads.
The second and harder thing to do is to find your top components. This is crucial. This is what's going to drive your advertising success for years to come.
This is also where your naming convention comes into play.
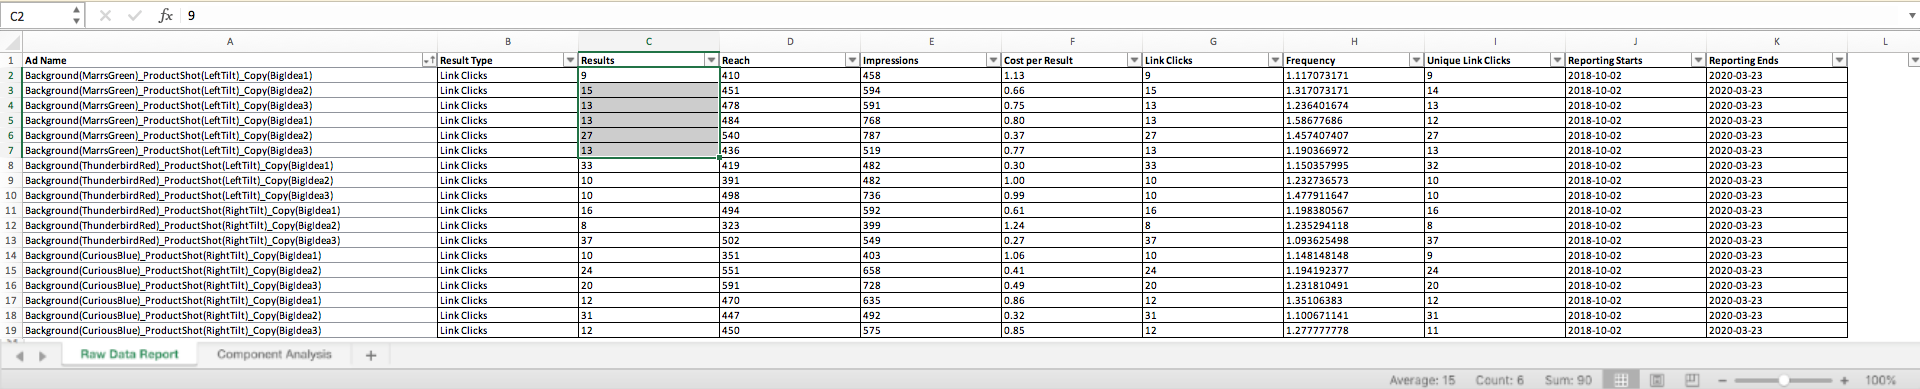
First, select all the ads in your campaign, then click Reports -> Create Custom Report. In the Ad Reporting viewer select Ad Name under Breakdown. Under Metrics, unselect Delivery, Campaign Name, and the various Quality Rankings.
You should only have selected your actual metrics, such as Results, Reach, and Cost per Result.
Then, in the top right corner, hit Export.
Once you've downloaded the file, you can start learning.
Hop into your spreadsheet program and sort your ads by name.
There's a ton you can do with this data, but that's an article for another time.
All you need right now are simple statistics.
Create a new sheet.
Title four columns: Component, Variable, Clicks, Avg. Clicks, Avg. CPR.
Now fill in your component column with Background, Product, and Copy (or whatever you used).
Fill the variable column with your colors, product shot names, and copy titles.
Using the Raw Data Report tab, summarize results and average Cost Per Result. Put those calculations into your Component Analysis tab.
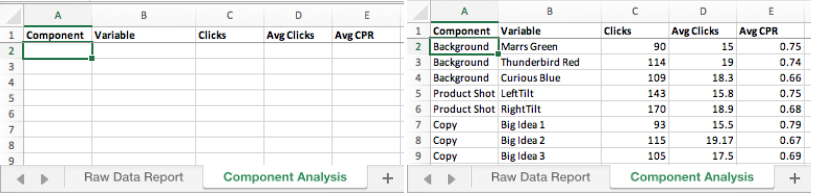
For us, top performers were Curious Blue, Right Tilt, and Big Idea 2 @ ¢0.67 per click:
Use those in your next campaign. Use them in your branding. Use them on your website. Use them all over!
Then continue testing.
Find more components. More effective components. Continuously improve your ads until your startup is an SMB, then a Conglomerate, then an international behemoth!
And that's how you perfect your startup advertising in 7 days for under $150.
To cut out the tedium, you can automate that whole process! Sign up for Marpipe's SaaS platform beta program!