
.jpeg)
Dynamic Product Ads (DPAs) are one of the best types of ads for performance marketers. DPAs make it easier to manage a catalog and figure out what a customer wants in real time by automatically sending the right product to the right person. Marketers are also asking harder questions, like how much it costs to run them and what kind of performance they can expect on sites like Meta, Google, and TikTok.
Benchmarks are important because they help people know what to expect. Marketers have a hard time telling if a campaign isn't working or if it's just following the rules without them. Budgets get messed up, and ROAS goals get messed up too. So, you need to know where each lever goes to get a clear picture of the numbers.
The Complexity of Benchmarking DPAs
Benchmarking DPAs is not as simple as lining up CPC averages. There are a few things that make them more complicated than static ad types.
First, attribution is messy and unclear. DPAs are most often used for retargeting, so they share credit with other touchpoints like search, email and display. For example, picture a customer who sees your Google Shopping ad on Monday, gets your promotional email on Wednesday, and then buys something after seeing a DPA on Instagram on Thursday night. Who gets the credit? Some sites will say that it was a DPA-driven sale, while others will say that it was the first click. Because of this overlap, it's harder to understand benchmark comparisons because the results often show how well the whole marketing mix is doing instead of just the DPA.
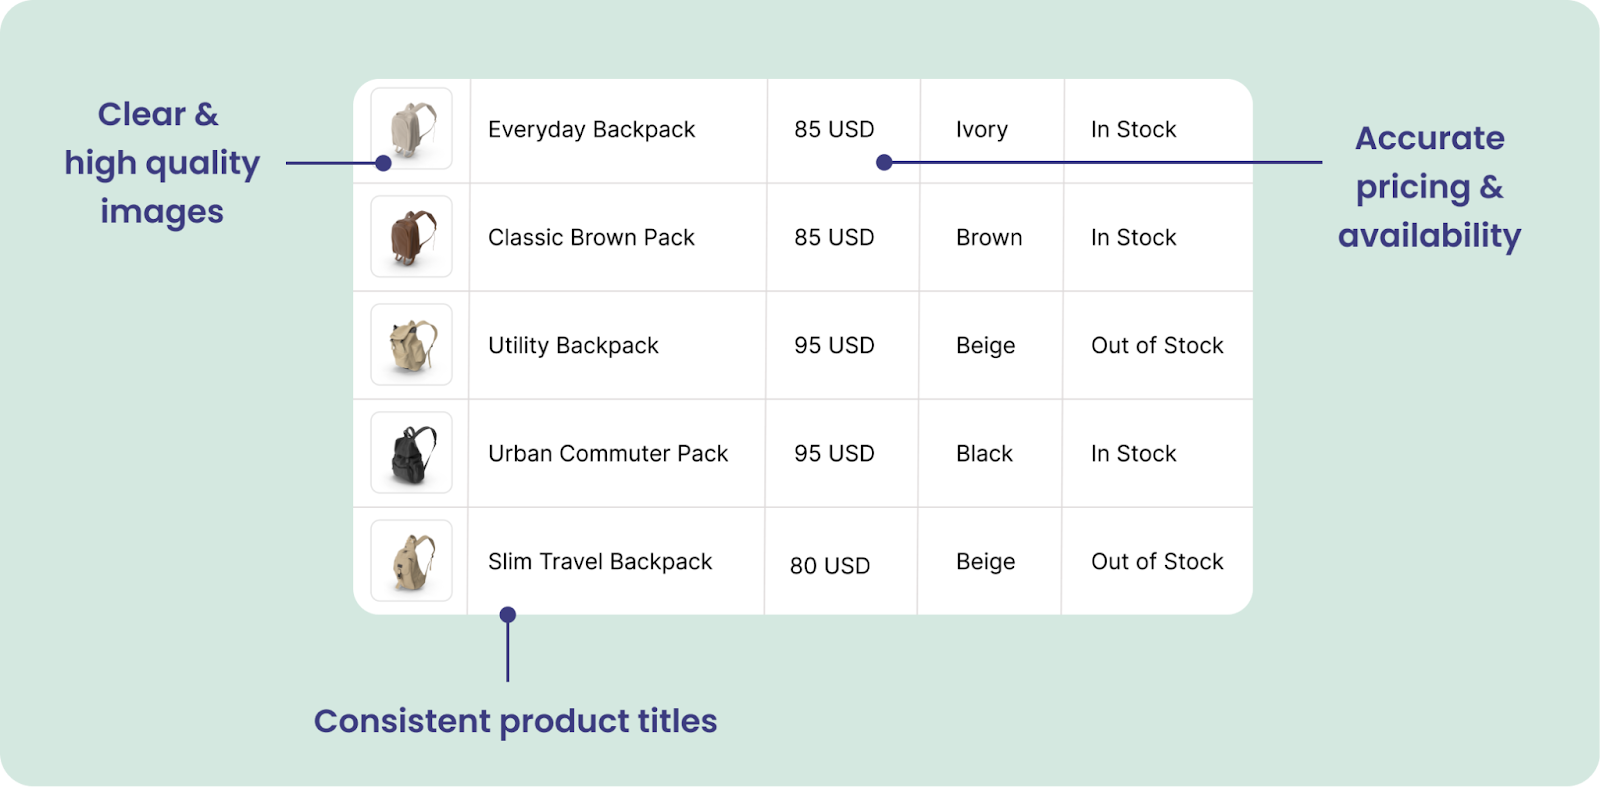
Second, the quality of a catalog affects how well it works. A polished product feed with consistent images, accurate pricing, and clear titles will get a lot more sales than one that is full of mistakes. Every metric shows that feed hygiene is the most important part of DPAs.
Third, the maturity of the audience affects how well things work. A brand with a lot of high-intent visitors will get better results than a new advertiser with fewer visitors. Depending on how big and new the audience is, the same budget will act differently.
Last but certainly not least, platform dynamics are not equal. Meta, Google, and TikTok all handle catalogs, which means that CPCs, CTRs, and conversion rates can vary. That’s why benchmarks should act more like guidelines than standards.
Core Metrics for Evaluating Dynamic Product Ads
It's not enough to just look at a dashboard and report back on a few big numbers when you want to know how well dynamic product ads are doing. For performance marketers, the goal is to connect every piece of data to growth and profit. That means keeping an eye on a small number of important metrics all the time and knowing how to read the connections between them. Each metric gives you a quick look at something. When you put them all together, they show how well your DPAs match up with your product feed, your creative, and your audience.
Return on Ad Spend (ROAS)
ROAS is still the most important metric for any campaign that wants to do well. It shows how much money you make for every dollar you spend. A good ROAS benchmark depends on the type of product. For electronics, which have low margins, a 2:1 return may be enough for advertisers. For clothing, which has high margins, a 4:1 or higher return is more common. You can't just look at ROAS by itself, though. A short-term rise in ROAS could hide the fact that you're targeting too many existing customers or relying too much on discounted goods. The real benchmark should be based on lifetime value and margin structure, not just revenue at the top.
Cost per Acquisition (CPA) or Customer Acquisition Cost (CAC)
CPA goes even further into efficiency by showing how much it costs on average to get one person to buy something or sign up. This metric is especially important for DPAs when you are trying to get people who left their carts or looked at product pages to come back. If a CPA is lower than your average order value, it means that DPAs are a cheap way to get back lost sales. If your CPA starts to get close to your AOV, it could mean that your creative isn't working right or that your feed is showing low-margin SKUs that can't cover the cost of getting new customers.
Cost per Click (CPC)
CPC shows you how much you're paying for engagement. When it comes to catalog ads, the CPC benchmarks are very different for each platform. Average CPCs on Meta are usually between $0.50 and $1.00, but Google Shopping campaigns usually cost more because they show a stronger intent signal. A low CPC can seem like a win, but if your conversion rates are also low, it could mean that your targeting is too broad or that your product selection isn't appealing to your audience. On the other hand, a higher CPC with high conversion rates can still be profitable if the margins are good.
Click-Through Rate (CTR)
CTR tells you how interesting your ads are in the feed or story setting. It shows how well your product images, copy, and audience fit together. Different types of businesses have different standards for strong CTRs, but for DPAs, you should aim for at least 1% on Meta and even higher on TikTok, where visual discovery leads to more impulsive interactions. A high CTR and low ROAS usually mean that people are interested in the creative but lose interest when they see the price, shipping, or availability. This is when the accuracy of the feed and the placement of the products are critical.
Conversion Rate (CVR)
CVR closes the loop by showing how many clicks lead to purchases. This is because DPAs retarget users with strong intent, which makes them better than static ads. Benchmarks are different, but a 2–3% CVR on Meta and a 4–5% CVR on Google Shopping are common. A low CVR is a warning sign. It could mean that the landing page isn't working well, the promotions don't match, or there isn't enough inventory. Because CVR comes after CTR, finding the difference between the two is important for improving DPA performance.
Feed-Level Metrics
Most marketers don't think of the feed itself as a performance driver, but metrics at the feed level can actually make or break campaigns. Coverage tells you what percentage of your catalog is currently eligible for ads. If your coverage rate is low, potential buyers won't be able to see valuable SKUs. Keeping an eye on the percentage of out-of-stock items makes sure you're not wasting money on things you can't buy, which can quickly lower conversion rates. Another sign is that performance is consistent across SKUs. If a few products are responsible for most of the spending and conversions, you might need to change your feed rules or segmentation to make long-tail items that are making money more visible.
Interpreting the Story Behind the Numbers
When you connect benchmarks to business context, they become useful. A low CPC and a low CVR mean that your audience is interested enough to click but not enough to buy. This is usually a sign that your product and audience aren't a good match. If the CTR is high but the ROAS is low, it could mean that the feed is pushing items with low margins or short lifetimes. If you rely too much on discounts or repeat customers, even strong top-line metrics can be misleading. That is why the best performance marketers don't just look at individual KPIs; they also ask how each one relates to contribution margin, customer lifetime value, and growth that can be scaled.
Platform-Specific Dynamic Product Ads Benchmarks
Meta Dynamic Product Ads Benchmarks
Benchmarks are useful when you put them in the context of your business. If your CPC and CVR are low, it means that your audience is interested enough to click but not enough to buy. Most of the time, this means that your product and audience don't go together well. If the CTR is high but the ROAS is low, it could mean that the feed is sending out items that don't make much money or don't last very long. Even if your top-line metrics are strong, they can be misleading if you rely too much on discounts or repeat customers. That's why the best performance marketers don't just look at individual KPIs; they also think about how each one affects contribution margin, customer lifetime value, and growth that can be scaled.
Typical benchmarks include:
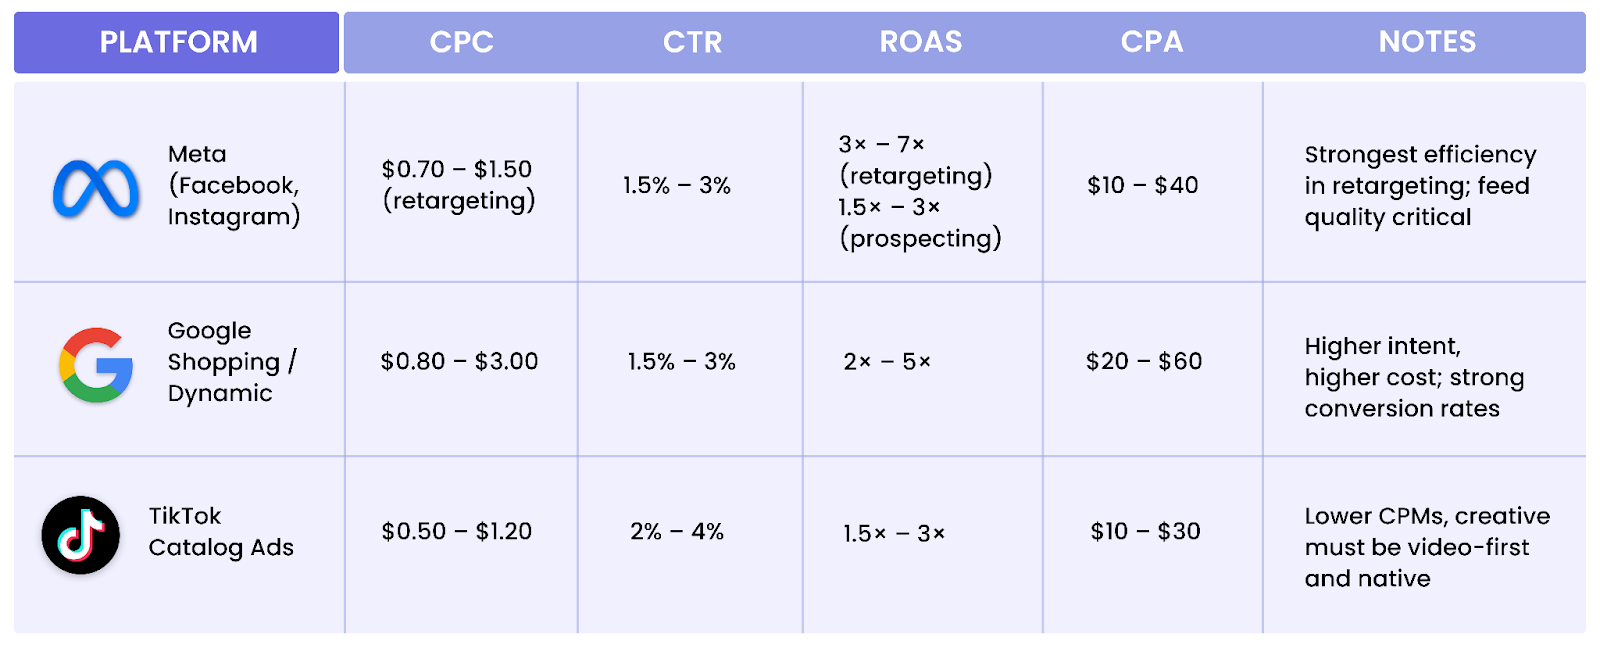
- CPC: Between $0.70 and $1.50 for high-intent retargeting segments. Broader prospecting with catalog ads often ranges from $1.00 to $3.00.
- CTR: Between 1.5% and 3% depending on vertical. Fashion and beauty often sit on the higher end, while electronics and B2B skew lower.
- ROAS: 3x to 7x in high-intent retargeting, tapering down to 1.5x to 3x in broader catalog prospecting.
- CPA: $10 to $40 depending on average order value and segment. What matters most is monitoring the relationship between CPA and contribution margin. If CPAs creep above what your gross margin can support, it’s a signal to refine audience segmentation or feed rules rather than simply lowering budgets.
Meta's benchmarks show that DPAs work best when two things are true: good feed hygiene and strict segmentation. High-frequency retargeting on a messy feed can quickly raise CPCs and lower ROAS. On the other hand, prospecting campaigns that use well-organized product sets and creative variation can reach more people without losing efficiency. Marketers who regularly check their product feeds to make sure they are available, have the right titles, and the right prices are in the best position to keep making money in Meta's changing environment.
Google Dynamic Shopping & Product Ad Benchmarks
Google's dynamic product advertising works through Shopping campaigns and dynamic remarketing. The environment is full of opportunities, but it's also more competitive, which drives up costs.
Benchmarks generally look like this:
- CPC: $0.80 to $1.50 for Shopping ads, but often $1.50 to $3.00 for competitive categories.
- CTR: 1.5% to 3% for Shopping placements, slightly higher in niche verticals.
- ROAS: 2x to 5x for most retailers, higher for brands with strong repeat purchase patterns.
- CPA: $20 to $60 depending on AOV and competition.
The 2025 Google Ads Benchmarks report says that the average CPC across all industries is $5.26, but Shopping campaigns tend to be lower. People are more likely to buy things on Google than on social media.
For instance, an electronics store might have CPCs close to $2.00 but a CVR higher than 7%. Brands of clothing, on the other hand, might pay closer to $1.00 per click, with conversion rates between 2% and 4%. The platform is good at converting people at the bottom of the funnel, but advertisers need to keep a close eye on their margins.
TikTok Dynamic Product Ads Benchmarks
The catalog ads on TikTok are the newest of the three big platforms, but they are growing quickly. For Gen Z and younger people, TikTok is where they find new products, and catalog-based dynamic ads are now driving sales.
Benchmark ranges are still forming, but early data suggests:
- CPM: $0.80 to $1.50 on average, lower than Meta and Google.
- CPC: $0.50 to $1.20 depending on targeting.
- CTR: Often higher than Meta, with averages between 2% and 4%.
- ROAS: 1.5× to 3× for most advertisers. Early adopters in fashion and beauty have reported even stronger returns.
- CPA: $10 to $30 depending on AOV.
CPCs on TikTok are around $1.00, and conversion rates are a little lower than on Meta because TikTok is more focused on discovery. Still, the cost-effectiveness can be appealing, especially for brands that are good at making videos first.
The main difference is how creative you expect things to be. When TikTok DPAs blend in with organic-style content, they work best. This means using catalog items in native video formats instead of still images of products. Brands that are willing to change their look get higher CTRs and lower CPCs.
Benchmark Table: Meta vs Google vs TikTok

What Drives Cost and Performance in DPAs
Feed Quality and Catalog Management
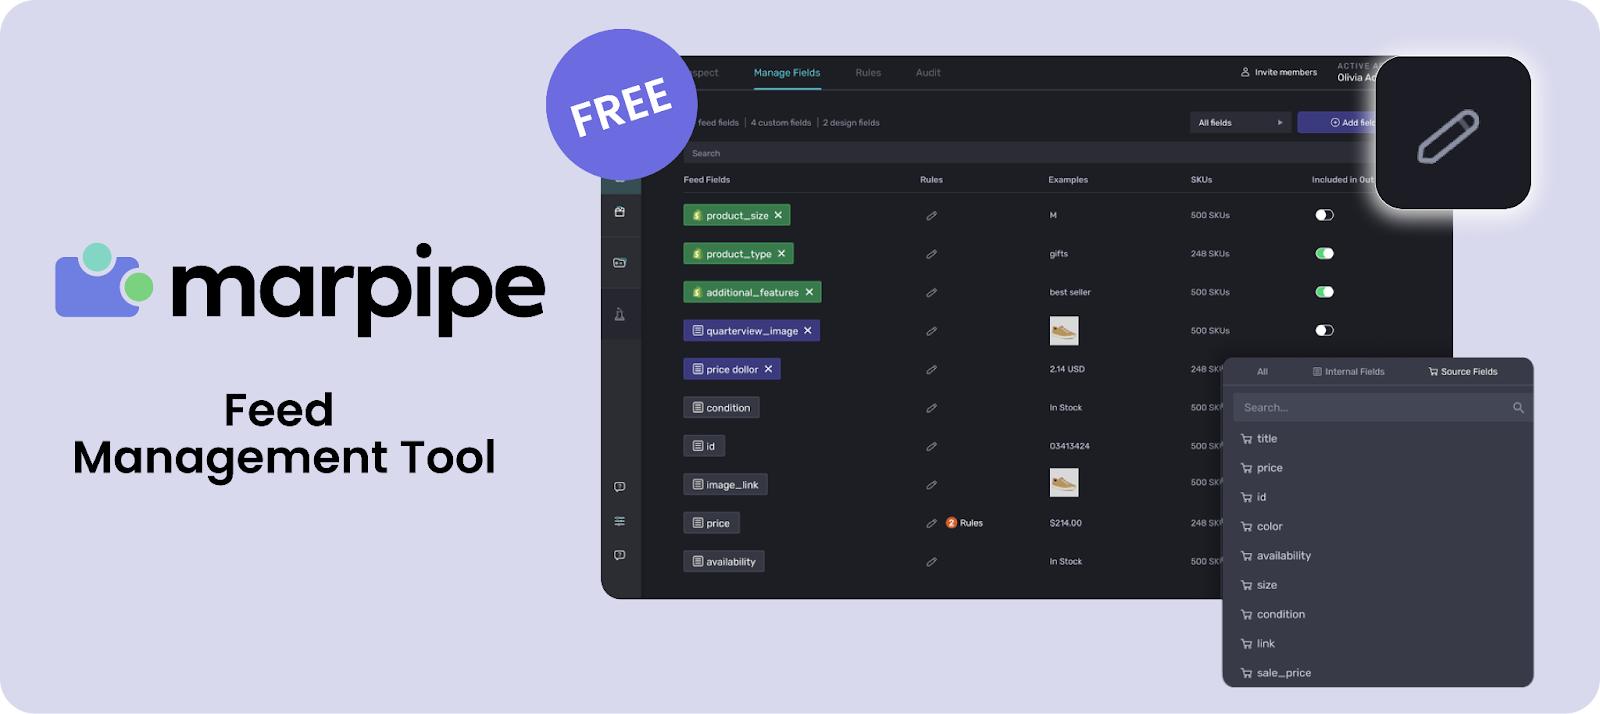
The feed is what makes DPAs work. If you don't have all the product information, have images that don't match, or have prices that are out of date, your CPCs will go up and your conversion rates will go down. Marketers can use Marpipe's free feed management tool to fix these problems by automatically cleaning up and adding to feeds
Audience Segmentation
One of the best ways to get people to pay attention is to break them up by how recently they saw something. A person who looked at a product yesterday is much more likely to buy it than someone who looked at it three weeks ago. By breaking up campaigns into groups of 0–3 days, 4–7 days, and 8–14 days, you can make sure that budgets go to the users who are most likely to buy.
Bid Strategy and Budget Allocation
Platforms can align delivery with performance goals by using bid caps or target ROAS bidding. Keeping costs down by giving more money to new retargeting pools and slowly growing in larger audiences is a good way to do it.
Creative Templates and Personalization
Overlays that show discounts, urgency, or product features can increase CTR and ROAS. Marpipe's dynamic product ads platform lets you make personalized creative templates on a large scale, which keeps ads new and useful.
Incrementality and Testing
Running hold-out tests shows whether DPA conversions are new or taken from other channels. Without these tests, benchmarks might make the real value seem higher than it is.
Where Benchmarks Are Heading in 2025
Today's benchmarks won't last forever. A number of trends are already changing what marketers can expect:
- AI-driven feed enrichment: Algorithms now automatically fill in missing data, create product attributes, and suggest better titles, which makes catalogs work better on a large scale. AdExchanger has written about this change as a way to set yourself apart from the competition.
- Platform convergence: Meta, Google, TikTok, Amazon, and Pinterest are all getting more involved in catalog-based ads, which makes DPAs a baseline across all channels.
- Attribution that puts privacy first: As cookie-based tracking goes away, incrementality testing and modeled conversions will become the norm. Retail Dive talks about how feed automation and privacy-driven measurement are coming together to create the next phase of advertising.
As these forces grow, benchmarks will keep changing. However, the basic idea stays the same: the closer the feed is to real inventory and the better the segmentation is at showing real intent, the better the returns.
Using Benchmarks the Right Way
Dynamic Product Ads are one of the best tools that performance marketers have. Their ability to link live product data with user intent leads to more engagement, higher conversion rates, and better efficiency than most other formats. But benchmarks should be seen as guides, not rules.
We recommend comparing your performance to the ranges in your industry and then adjust those ranges to fit your unit economics. If your campaigns aren't doing as well as they should be, you might want to look at feed hygiene, segmentation, or creative templates to see if they can be improved. If they go above and beyond, be careful when scaling up and keep an eye on incrementality.
Marpipe gives marketers the tools they need to outperform benchmarks in 2025 and beyond. You can clean up and add to your product data with our free feed management solution, make more creative variations using our Gen AI tools, and optimize to automatically filter out your worst-performing catalog campaigns, so keep improving ROAS on Meta, Google, and TikTok.
Get started with Marpipe today to see how we can help you reach your goals.