.jpeg)
Every ad has a life cycle. At first, it feels fresh, attention-grabbing, and maybe even a little clever. But over time, the same image, video, or copy, starts to feel repetitive. Lose its luster. Cause an immediate scroll. This phenomenon is what we marketers like to call creative fatigue. And it seems to be happening more rapidly today.
Creative fatigue happens when an audience has seen an ad too many times, and instead of clicking through or researching, it starts to hum in the background. Think about the last time you scrolled past the same fall boot ad for the tenth time in a week. At first you noticed it, maybe even clicked the link and considered buying. But by the fifth or sixth time you’ve seen it, you just immediately keep scrolling. That drop in attention is exactly what creative fatigue is.
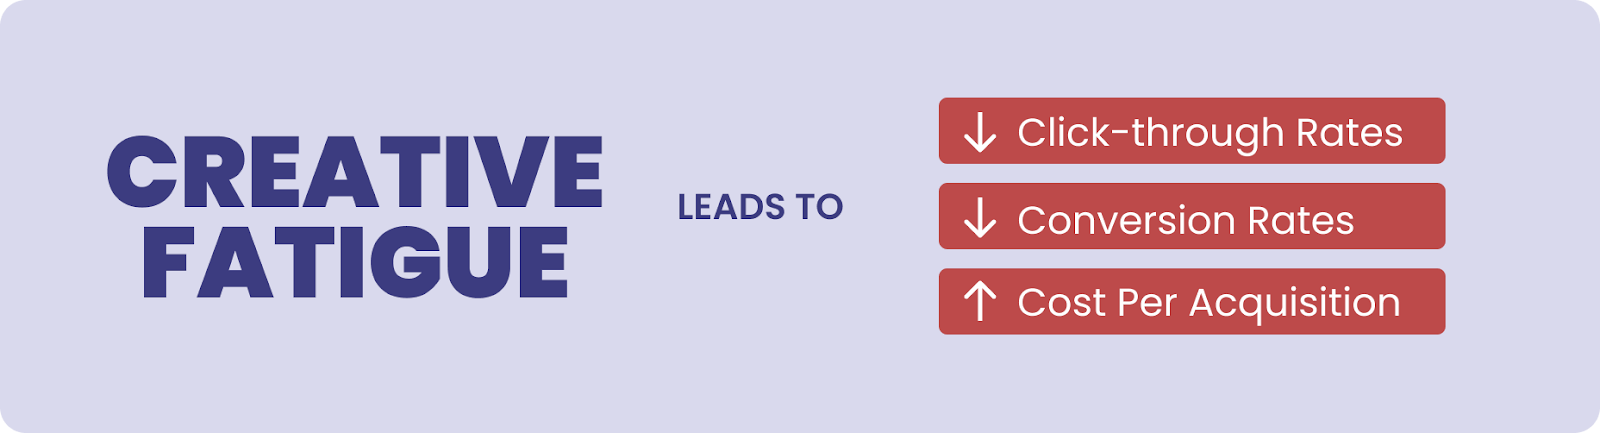
Fatigue shows up in the numbers: click-through rates fall, conversion rates slide, and cost per acquisition creeps upward. And, it’s not necessarily boredom. It’s more like burn out. With hundreds of ads served a day, audiences are more susceptible to being burnt out from consumerism.
Why Creative Fatigue Matters in Advertising
Creative fatigue can be one of the costliest drivers of wasted ad spend. Once an audience has been exposed to the same asset too many times, the economics of the campaign can begin to shift. The budget remains constant, but the output in terms of clicks, conversions, and revenue steadily declines.
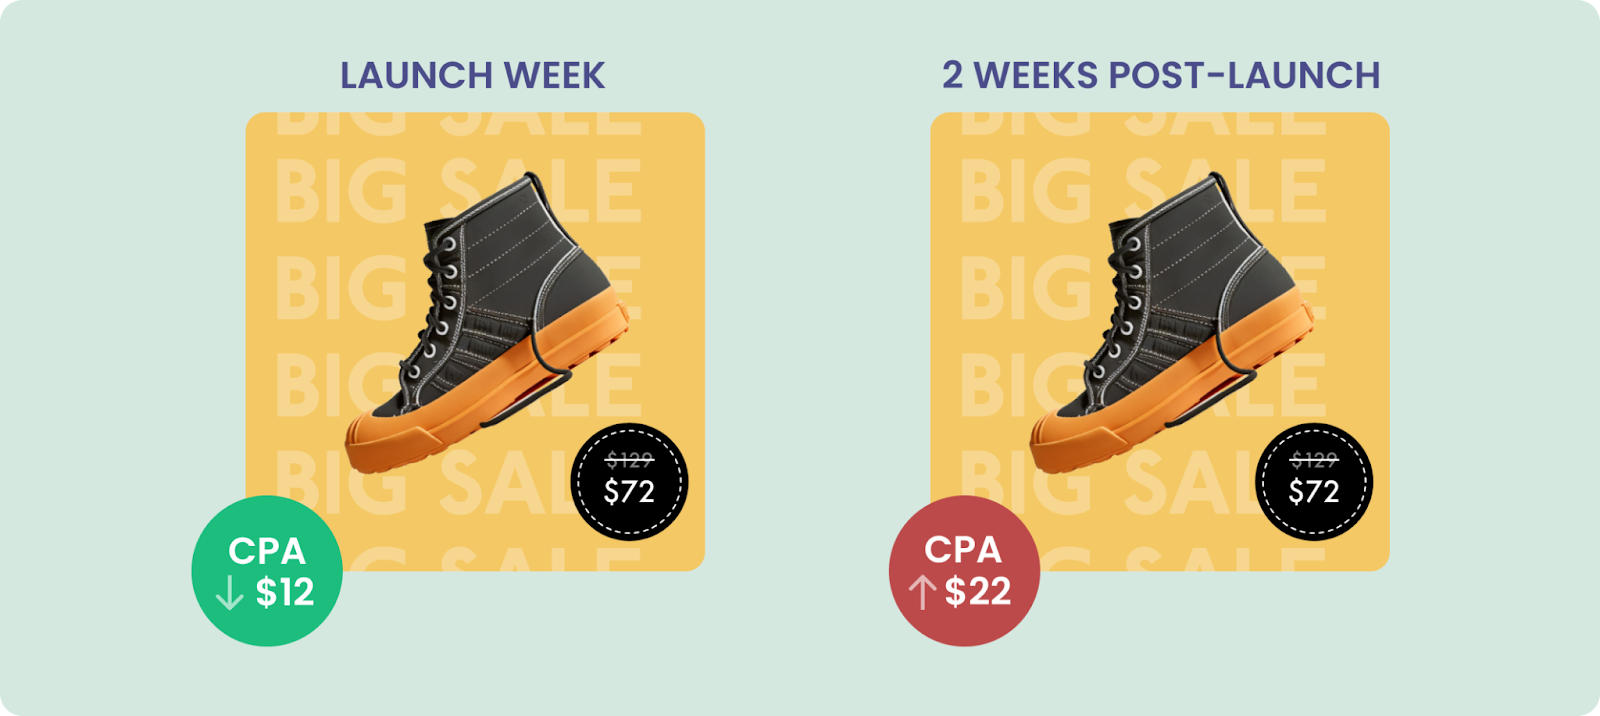
Let’s look at an example. Let’s say that you run a mid-sized running apparel company. You decide to run Facebook catalog ads. At launch, the strongest-performing video achieves a $12 cost per acquisition (CPA). Two weeks later, with the same targeting, budget, and bidding strategy, the CPA has climbed to $22. Nothing structurally changed in the campaign. It’s likely that the decline was driven entirely by creative fatigue, doubling acquisition costs in less than fifteen days.
The pace of this erosion varies by platform. On TikTok and Instagram Stories, high-frequency delivery cycles push ads toward fatigue in a matter of days. TikTok’s own research suggests that consumer-facing campaigns often reach saturation within 7–10 days. By contrast, on LinkedIn, where ad frequency is lower and decision cycles are longer, creative can remain effective for four to six weeks. The context of the platform determines how quickly fatigue arrives, but in every case, it is unavoidable.
The consequences are significant:
Efficiency goes down. A tired ad costs the same amount of money but gets less and less value. A campaign that used to bring in 3x the amount of money spent on ads (ROAS) may now only bring in 1.5x, which cuts profits in half. That loss of efficiency adds up to tens of thousands of dollars in wasted spending when you do it on a large scale in many markets or product categories.
Positioning in the market is weaker. Advertising platforms use auction models that reward ads that are relevant and get people to interact with them. New creative usually gets more engagement, which means that competitors with newer assets will get more impressions for less money. A brand that runs tired creative not only loses efficiency, but it also loses share of voice across placements.
More diagnostic mistakes. Teams often get the signals wrong. A low click-through rate (CTR) can be caused by bad targeting, a small audience, or weak bidding. The creative has really just run out of time. Incorrect diagnoses slow down the real solution, waste resources, and put strategic mistakes at risk of spreading.
Algorithms deprioritize older ads. Algorithms on platforms reward people who are active. When assets don't do well, they lose their place in the auction and mess up the optimization process. Fatigued creatives not only hurt current performance, but they also hurt future learning because the data they collect no longer shows real audience interest.
The effect goes beyond just one campaign. When people get tired of being creative, it can hurt both the effectiveness of media spending and the accuracy of the data that guides long-term strategy. For brands that spend six or seven figures on digital ads, it's important to recognize and deal with fatigue in order to keep growing.
Signs of Creative Fatigue
It’s not always obvious when a campaign is creatively fatigued. The signs can look a lot like other problems with the campaign, such as bad targeting, weak retargeting, or inefficient strategies. Still, there are a number of reliable signs that, when put together, point to fatigue as the main cause.
Declining click-through rate and engagement rates
A quick drop in click-through rate (CTR) or engagement compared to how well it did before is the most obvious sign. For example, an ad that started with a 2.8% CTR but is now below 1.5% could be a sign that people are getting tired of it. A single drop could just be statistical noise, but a steady downward trend over several reporting windows is a clear sign of decay.
Rising acquisition costs
Costs of acquisition go up as interest wanes. The easiest way to find the driver is to break down CPA into CPC and CVR. CPC divided by CVR equals CPA. If CPC stays the same but CVR goes down, it means that the creative is doing less work even for people who click. If CVR stays the same while CPC goes up, the auction has to clear at a higher price because people are less likely to engage. Both patterns are consistent with fatigue, but they suggest different solutions. Think about a prospecting ad that started with a $20 CPA, a $1.00 CPC, and a 5% CVR. Ten days later, the CPA is $35. The creative is hurting both the auction prediction and the post-click motivation if CPC is now $1.25 and CVR has dropped to 3.6 percent. Changing bids or audiences won't fix things like a stronger idea or a new cut can.
Elevated frequency and shrinking first-time reach
You should read frequency in relation to the size of your audience and the goal of your campaign. Retargeting pools can have more frequent weekly visits than broad prospecting, but even there the returns level off. On Meta, look at both lifetime frequency and weekly frequency, and then combine them with the First-time Impression Ratio. When first-time impressions drop below 40 to 50 percent and weekly frequency goes up to 4 to 6 in prospecting without a corresponding rise in CTR, you're paying to show the same people an ad they don't want to see. At the same time, unique reach will level off, which shows that delivery is going through the same group of people instead of finding new ones.
Audience pushback and negative feedback rate
Creative fatigue can manifest through subtle qualitative indicators that are often disregarded. Hidden posts, comments that say "seen this too often," and more negative feedback per thousand impressions show that the audience experience has gone from familiar to annoying. At scale, even a small rise is important. If hides per one thousand impressions go from 0.6 to 1.8 over the course of a week and CTR goes down while frequency goes up, you have a clear story of wear-out. These signals don't often get better on their own, so leaving the asset as is will make the problem worse by lowering the predicted engagement for the ad set.
Falling relevance diagnostics and quality rankings
Platform diagnostics can help confirm the picture. On Meta, track quality ranking, engagement rate ranking, and conversion rate ranking. A common pattern we’ve seen is a shift from Above Average or Average to Below Average after seven to ten days in high-velocity environments. On LinkedIn, we recommend you watch the Relevance Score and social actions per impression, particularly for single image and document ads that can hold longer but then fall off sharply. On YouTube, view rate at 25 and 50 percent can remain stable while 75 percent collapses as repeat viewers tune out the middle of the story. If rankings deteriorate alongside CTR and frequency, the algorithm is telling you the creative is losing its competitive edge in the auction.
Performance variation by placement and audience segment
Here’s what we know: fatigue doesn’t hit every channel the same way. Stories and Reels lose effectiveness faster than Feed. Younger audiences on short-form video platforms tire of ads sooner than older audiences on desktop-heavy placements. Track results by placement, device, and age band. If a creative still holds a 2.2 percent CTR in Facebook Feed after two weeks but drops to 0.9 percent in Instagram Stories, rotate a Stories-first cut instead of retiring the concept. On LinkedIn, B2B Sponsored Content can run for four to six weeks if frequency is managed and the audience is large. There is no single threshold for fatigue because it’s a set of curves that vary by channel and segment.
Leading versus lagging indicators
CPA is a lagging indicator. By the time it moves, money is already gone. Treat early video hook rate, first-time impression ratio, unique reach growth, and 3 to 7 day CTR slope as leading indicators. When these begin to slip in parallel, schedule a refresh before costs spike. In practice, many teams set guardrails such as a 25 to 35 percent CTR decline from launch baseline or a two-point drop in Meta Quality Ranking to trigger rotation. You will still validate with a controlled test, but the guardrails prevent prolonged decay.
How to confirm it is fatigue, not seasonality or targeting
The fastest way to confirm fatigue is an A/B test within the same audience. Launch a new cut that keeps the offer and targeting but changes the hook, pacing, or visuals. If CTR recovers and CPC drops within 24 to 48 hours while the control keeps sliding, it’s fatigue. Another check is to move the weak asset into a fresh audience of similar size. If results improve only briefly and then decline on the same schedule, the problem is the creative, not the audience. A final test is to compare conversion rates. If CVR stays consistent across landing pages and devices but costs rise in line with falling CTR, you’ve confirmed the creative is the issue.
The pattern to look for
A typical fatigue pattern looks like this. Days one to three: CTR stabilizes after learning at 2.3 percent in Instagram Feed and 1.9 percent in Reels. Days four to seven: frequency climbs from 1.4 to 2.8, first-time impression ratio falls from 62 percent to 46 percent, and CTR drops to 1.6 percent. Days eight to twelve: Quality Ranking slips to Below Average, CPC rises from $0.95 to $1.28, and CPA increases from $24 to $36 while landing page CVR holds steady at 4.1 percent. When these indicators move together, it signals creative fatigue. Update the asset, not the audience plan.
How to Calculate Creative Fatigue
There is no exact formula for creative exhaustion, but it shows itself in a clear way across all measurements. The first sign is usually a steady drop in engagement, which happens when advertising that used to get people's attention start to lose their appeal. Rising frequency without new clicks or conversions strengthens the case, particularly when the same audience sees the ad multiple times without acting. Costs of acquiring new customers often go up at the same time, even though nothing else in the campaign has changed. Platform diagnostics, like decreasing relevance or quality scores, give further proof that an asset is worn out. Testing a fresh creative variation is the most reliable approach to check for weariness. If the new version works much better but the old one is becoming worse, it means that weariness is causing the deterioration.
Establishing practical thresholds
Because each platform and vertical has its own set of rules, teams often set their own limits for fatigue. Some common rules are:
- A 25–35 percent CTR decline from launch baseline.
- A frequency above four in prospecting audiences without corresponding lift.
- A CPA increase of 40–50 percent with stable downstream conversion rates.
- A drop of at least one tier in Meta Quality Rankings sustained across three days.
These thresholds are not set in stone, but they do give us a way to measure fatigue instead of just guessing.
Creative Fatigue vs. Audience Saturation
Creative fatigue and audience saturation often look similar, but they are not the same. Fatigue happens when performance declines even though the audience pool is still fresh. Saturation happens when the audience has been overexposed, regardless of the asset.
The best way to tell the difference is by testing. If a new creative cut restores CTR and lowers CPC within the same audience, the issue is fatigue. If performance only rebounds when you expand to a fresh audience, the issue is saturation. Another sign is that with fatigue, conversion rates usually stay stable while costs rise. With saturation, both engagement and conversion slip because the audience has been tapped out.
The answer depends on the diagnosis. A new hook, pacing, or visual can help you get your creative juices flowing again when you're tired. To reach saturation, you need to grow your audience by using bigger pools, new lookalikes, or new targeting criteria.
Common Mistakes When Measuring Creative Fatigue
One of the biggest challenges with fatigue is misdiagnosis. Performance drops for many reasons, and it is easy to mistake other issues for creative wear.
A common mistake is treating a short-term fluctuation as fatigue. It's normal for things to go up and down from day to day, so don't call it quits until you see a steady decline over several reporting periods. Another mistake is to only look at one metric. CTR, CPC, or CPA alone do not prove fatigue. It is the combination of declining CTR, rising CPC, and stable CVR that points to the creative.
Some marketers also reset audiences too quickly. If a fresh cut lifts performance in the same pool, the creative was the issue. Changing targeting before testing a new asset wastes reach and blurs the signal. Finally, do not ignore frequency and first-time impression ratio. Rising frequency and shrinking new reach are often early signs that an audience, not the creative, is the limiting factor.
How to Reduce Creative Fatigue
The best way to avoid getting tired of being creative is to add variety to your work. Even if the original asset is still doing well, you should regularly switch out new cuts. Changing the creative hook, the pace of the edits, or the visual system by small amounts can make a campaign last longer without having to start over from scratch.
Adapting creative to the placement is equally important. As we’ve mentioned before Instagram Stories and Reels, as well as TikTok videos, tend to wear out faster than Feed, so assets designed for those environments should be refreshed more frequently. Rather than forcing a single version everywhere, create placement-specific cuts that match how people consume content in that channel.
Distributing impressions more strategically also helps. Splitting audiences by age, device, or behavioral traits spreads reach more evenly, which slows down fatigue and prevents certain groups from being overexposed.
Lastly, think of testing as something that happens all the time. You can catch fatigue before CPC and CPA go up by keeping an eye on early signs like an increase in frequency, a decrease in the first-time impression ratio, and a steady decline in CTR. Running A/B tests on the same group of people can quickly show you if the creative is what's holding back performance and which parts need to be changed. You can keep results over time and avoid getting tired by managing creative as a portfolio in rotation instead of as a set of fixed assets.
Tools and Metrics to Track Creative Fatigue
To keep an eye on creative fatigue, you need both platform-native analytics and outside tools that give you a bigger picture of how well your campaign is doing. When you read the signals on each platform correctly, they tell you when an asset is starting to lose its effectiveness.
Frequency, CTR, and cost metrics are important on Meta, but the best indicators are often quality and relevance rankings. If the quality score, engagement ranking, or conversion ranking goes from average to below average, it means that the algorithm is predicting weaker performance, which usually means that the user is tired. Meta's breakdown by placement also makes it easier to see if fatigue is happening more quickly in Stories, Reels, or Feed.
Google Ads gives comparable signals, especially on YouTube, where you can see how many people watch videos and for how long at different times of the day. If the number of early views goes down or the average watch time gets shorter, it usually signifies that the creative isn't interesting anymore. When impressions stay the same but CTR goes down, that's another symptom of wear-out.
Using third-party solutions to connect data from different platforms can provide you even more insight. Marketers can utilize analytics tools like Northbeam or Lebesgue to look at the life cycles of creative assets next to each other and observe how worn out they are. These platforms are better for finding patterns across channels than for responding to changes that happen in just one platform.
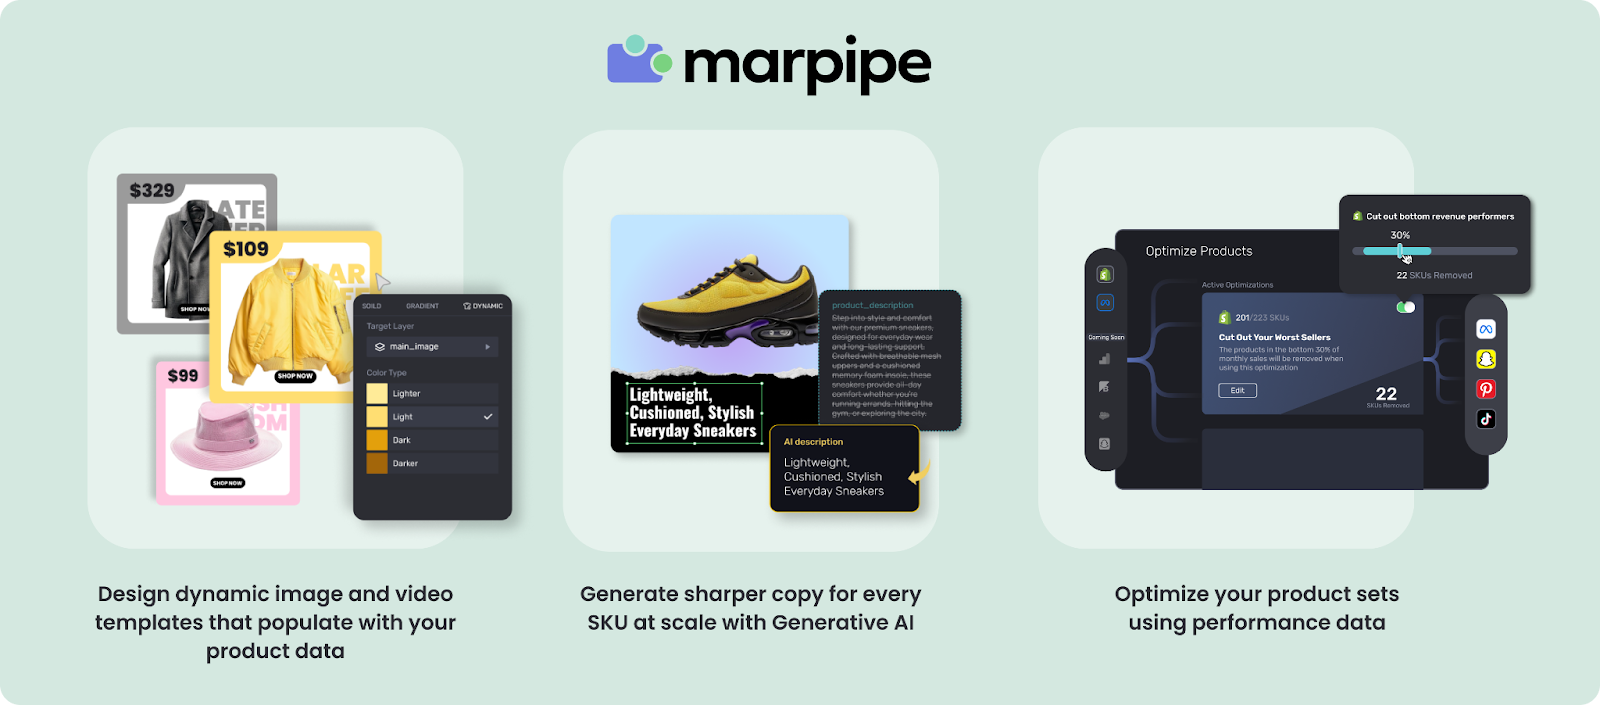
Marpipe takes this a step further by combining clean product feeds with creative automation. This lets marketers make more new ads without losing track of which ones are getting old. When fatigue is tracked along with testing and feed health, teams can refresh more regularly instead of only when costs go up.
The most important thing is to be consistent. Fatigue is not something you check once and then forget about; it's something you keep track of. What matters most is that you keep an eye on the signals, write down patterns, and make decisions based on data instead of gut feelings, whether you use native dashboards or third-party platforms.
Building Systems to Stay Ahead of Creative Fatigue
Creative fatigue isn't a problem with your campaigns; it's just how people react to ads. No matter how good an ad is when it comes out, it won't last forever. The difference between good and bad marketers is that good marketers can spot fatigue early, take action quickly, and create systems that keep their creativity fresh. When engagement goes down, acquisition costs go up, and platform diagnostics get worse, it's time to rotate, not panic.
The best teams see fatigue as a cycle that keeps happening instead of something that happens once in a while. They plan creative refreshes ahead of time, use templates that make it easy to change things up, and keep an eye on fatigue along with core efficiency metrics like ROAS and CAC. They keep their campaigns efficient, protect learning signals, and make sure they can grow by doing this.
We help brands put this discipline into action at Marpipe by giving them clean product feeds, scalable product videos, and Gen AI that is optimized for scale. If you are ready to stop reacting to fatigue and start building a system that keeps your campaigns competitive, get started with Marpipe today.