

When your multivariate experiment is compete and you've spent your test budget, the last and most important step is to analyze the results of your ads. We've built a Creative Intelligence (CI) Template in Google Sheets that you can use to organize your data by simply following the instructions below!
01 Data Analysis Sheet
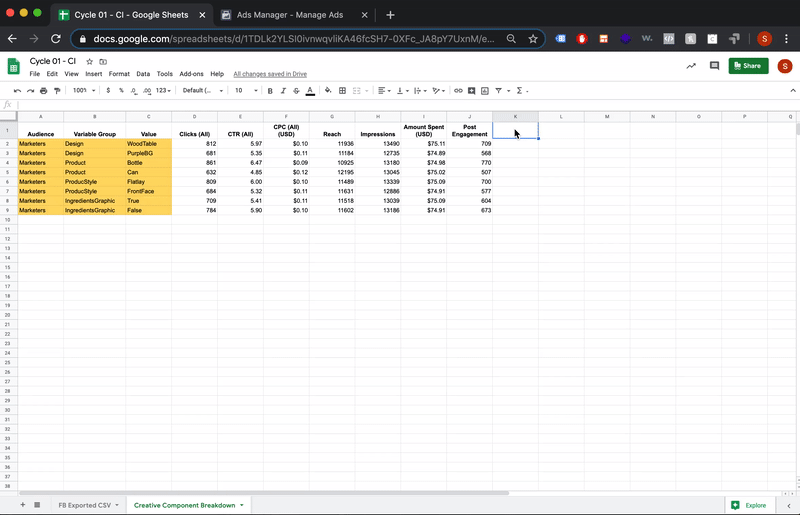
Create a Google Sheet in your Drive and name it based on the experiment, for our example we've named the sheet "Cycle 01 - CI." Make two tabs to reflect the tabs in our template - to ensure the preset formulas work make sure the exported data tab name is exactly "FB Exported Data", you can call the second tab whatever you'd like. Copy and paste the cells from our Creative Component Breakdown tab into the same tab of your sheet.
Within your sheet, the first step you'll need to take is writing out the variable outline of your experiment by replacing the cells highlighted in yellow from our template.
Write your groups in the Variable Group column and your tested variables in the Value column. If you tested with more than one audience, duplicate the cells from the outline that you just created directly underneath themselves and change the audience name. Add rows or columns as needed by duplicating the same rows or columns. Delete excess rows or columns if needed.
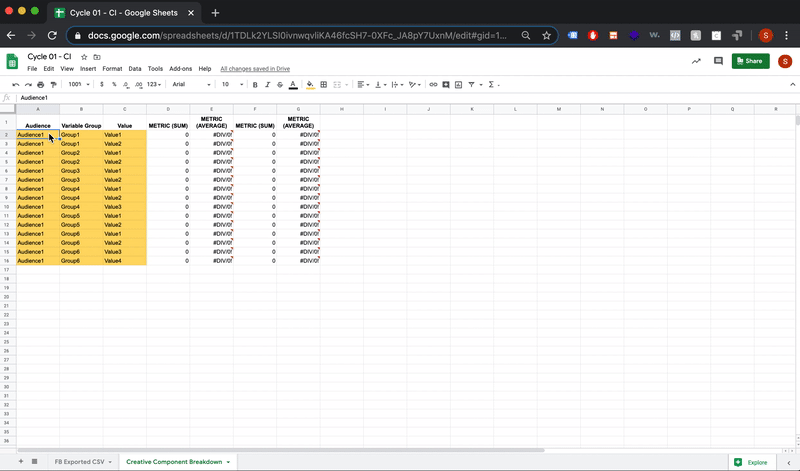
The completed set up should look similar to the screenshot below.

02 Organize & Export
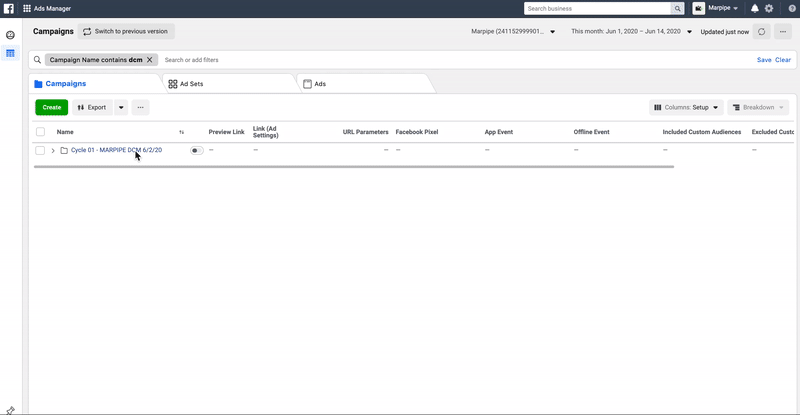
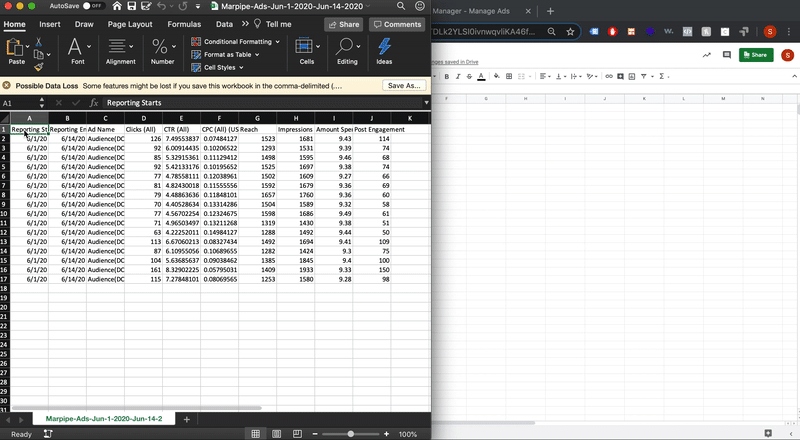
Now that you've created your database, open your Facebook Ad Account and go to your experiment campaign. You will need to organize your Facebook columns so they are ready to be exported and pasted into you CI sheet. It's important that you follow the below notes regarding the sheet template columns when choosing your Facebook export columns.
- METRIC (SUM) - these columns are for data meant to be added, such as purchases, clicks, leads, etc.
- METRIC (AVERAGE) - these columns are for data meant the be averaged, such as cost per purchase, clickthrough rate, cost per click, etc.
One additional note, Facebook exports always include two columns at the beginning - Reporting Starts & Reporting Ends. You can ignore these columns, we've factored them into our preset formulas.
For this example, we are exporting the columns Clicks (All), CTR (All), CPC (All), Reach, Impressions, Amount Spent, and Post Engagements. Those metrics need the below column set up in our sheet, so we copied their respective presets into that order. Do not include any unnecessary columns in your export.
- Clicks (All) - METRIC (SUM)
- CTR (All) - METRIC (AVERAGE)
- CPC (All) - METRIC (AVERAGE)
- Reach - METRIC (SUM)
- Impressions - METRIC (SUM)
- Amount Spent - METRIC (SUM)
- Post Engagements - METRIC (SUM)
With your Facebook columns and your data sheet columns set up, export your Facebook data, then copy and paste it into the FB Exported CSV tab. Reformat the look of the data in your columns as needed - for example, we made the CPC (All) and Amount Spent columns "Currency."
03 Results Analysis
If you've followed the instructions in this article you should see the creative data of your chosen metrics! From here, use the raw creative data to build different forms of analysis. For this example we added the below columns as additional ways we'd like to analyze our data.
- Post Engagements / Impressions
- Cost per Post Engagement
Depending on what metrics you exported, there are plenty of ways to parse through your creative data. Add as many columns as you need to analyze your results. Last, create charts and graphs as you'd like, then just review the data to find your winning outliers.
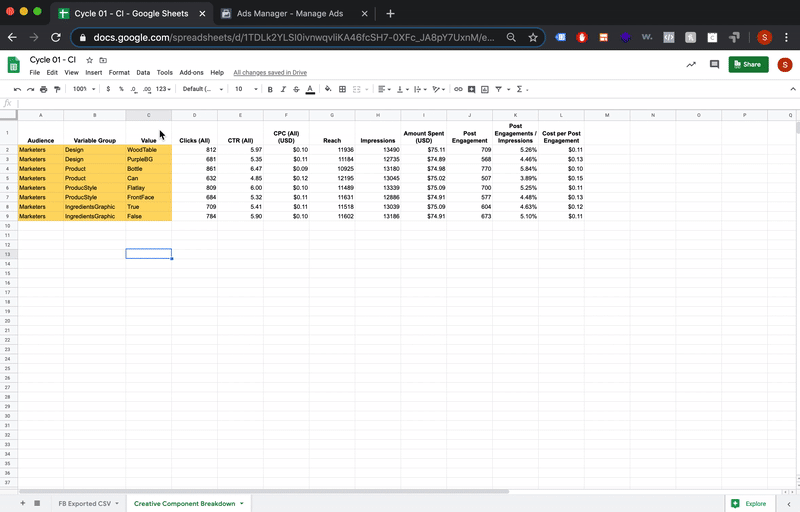
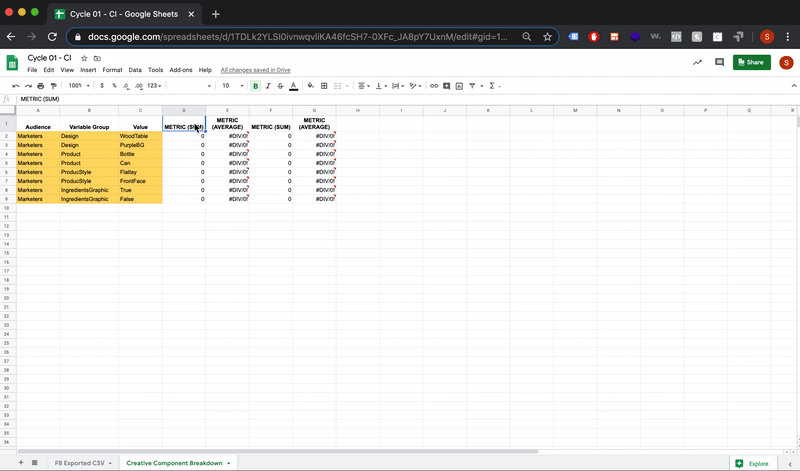
From our example, we can see that the Product variable "Bottle" is one of the most impactful creative elements. The Bottle image had the most clicks, highest CTR, lowest CPC, and lowest Cost per Post Engagement! In our next experiment we'll remove the Can image, which was being tested in the same group as the bottle.
Another interesting finding coming from the "IngredientsGraphic" group - including ingredients brought in less clicks overall, but also had a lower CTR than not including ingredients. This would be a good group to test further before deciding on a winner.

Note: if you're interested in checking out this example you can access it here.